Mental State Visualizer
Creative embedded systems project that combines art and technology to visualize your brain's electromagnetic activity.
Role
Engineer, Designer
Date:
Oct - Dec 2024
Team
Haley Flores,
Joe Maffa,
Lynda Umuhoza
Skills
Arduino
Processing
Soldering and Metalwork
Overview
Interpreting brainwaves is often associated with clinical or scientific applications. Our team wanted to explore this concept from a more creative angle, focusing on the relationship between brainwaves, mental states, and how they can be visually interpreted in an accessible way.
While researching ways to measure brain activity, we discovered that many advanced devices were beyond our budget. Fortunately, we found an unexpected solution in the Mindflex, a toy released by Mattel in 2009. Mindflex uses an EEG headset to register brainwaves, allowing users to manipulate an air stream and guide a foam ball through an obstacle course by concentrating.
We chose to use art as the medium to visualize and communicate what these brainwaves represent-- our efforts culminating in this project!
Hacking The Mindflex
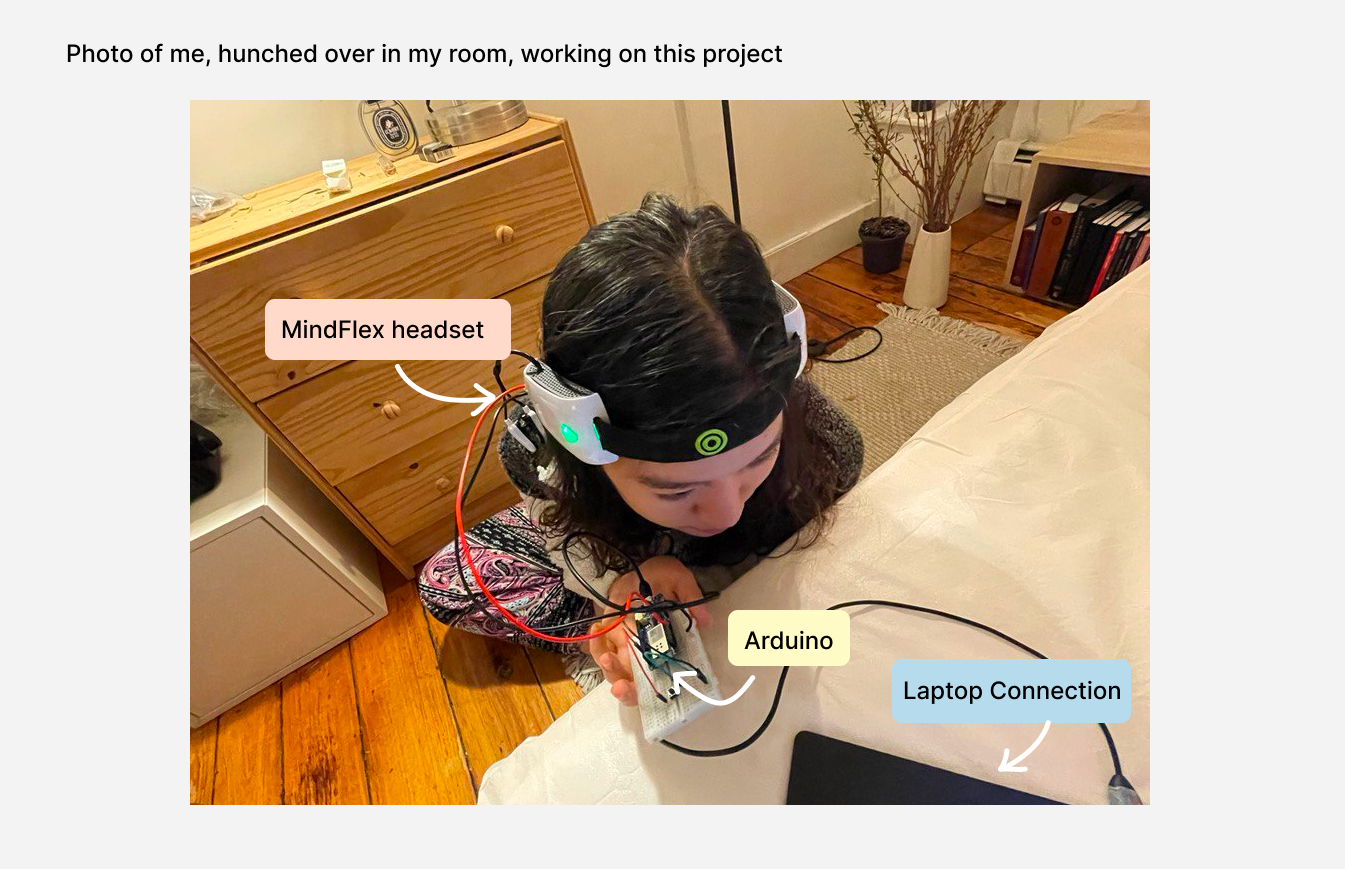
Following this tutorial by FrontierNerds, we hacked the Mindflex and connected it to an Arduino, allowing us to “peek” at the brainwave activity data the chip processes. This was also a great opportunity for us to pick up new skills such as metalwork and soldering!
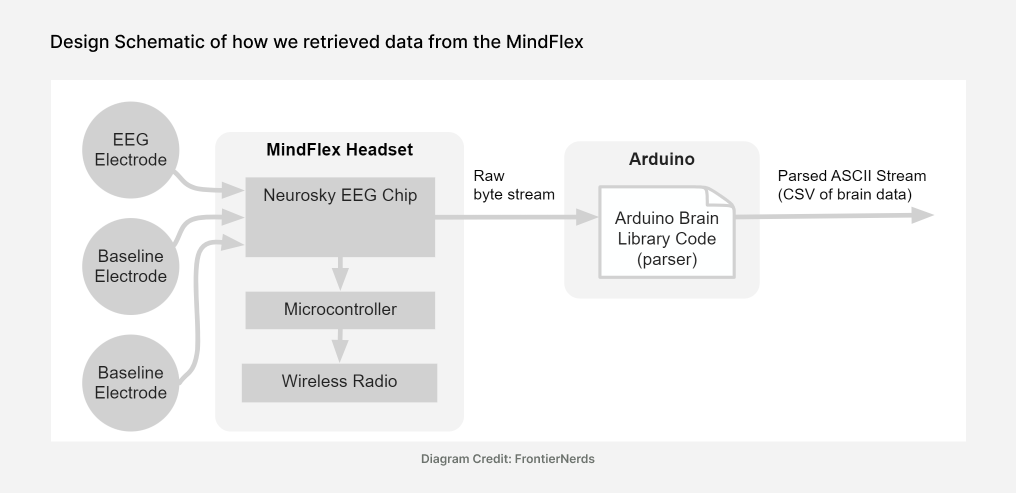
We found that the EEG chip detected brainwave activity through electrical signals at different frequencies. For our project, we chose to focus on three key frequencies where we observed the most significant changes: Attention (Low Beta frequencies, 13-17Hz), Meditation (Theta frequencies, 4-7Hz), and Delta frequencies (1-3Hz).
Creating the Visualization
After we retrieved the brainwave activity data via the Arduino software, we proceeded to translate the datastream into an interactive visualization using Processing. The relationship between the Mindflex headset, Arduino, and visualization is depicted in the following architecture diagram:
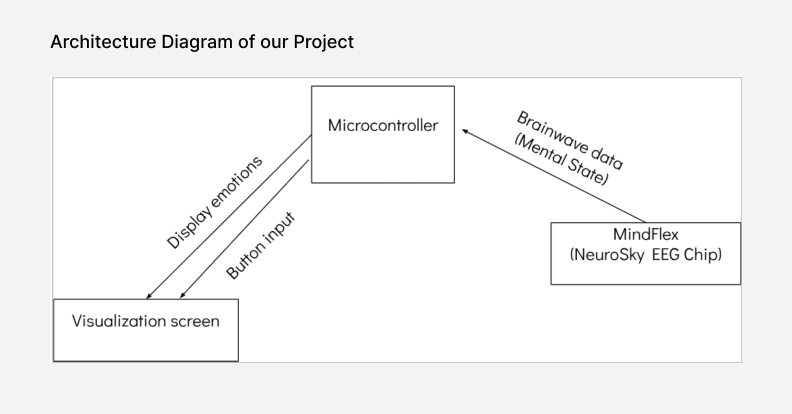
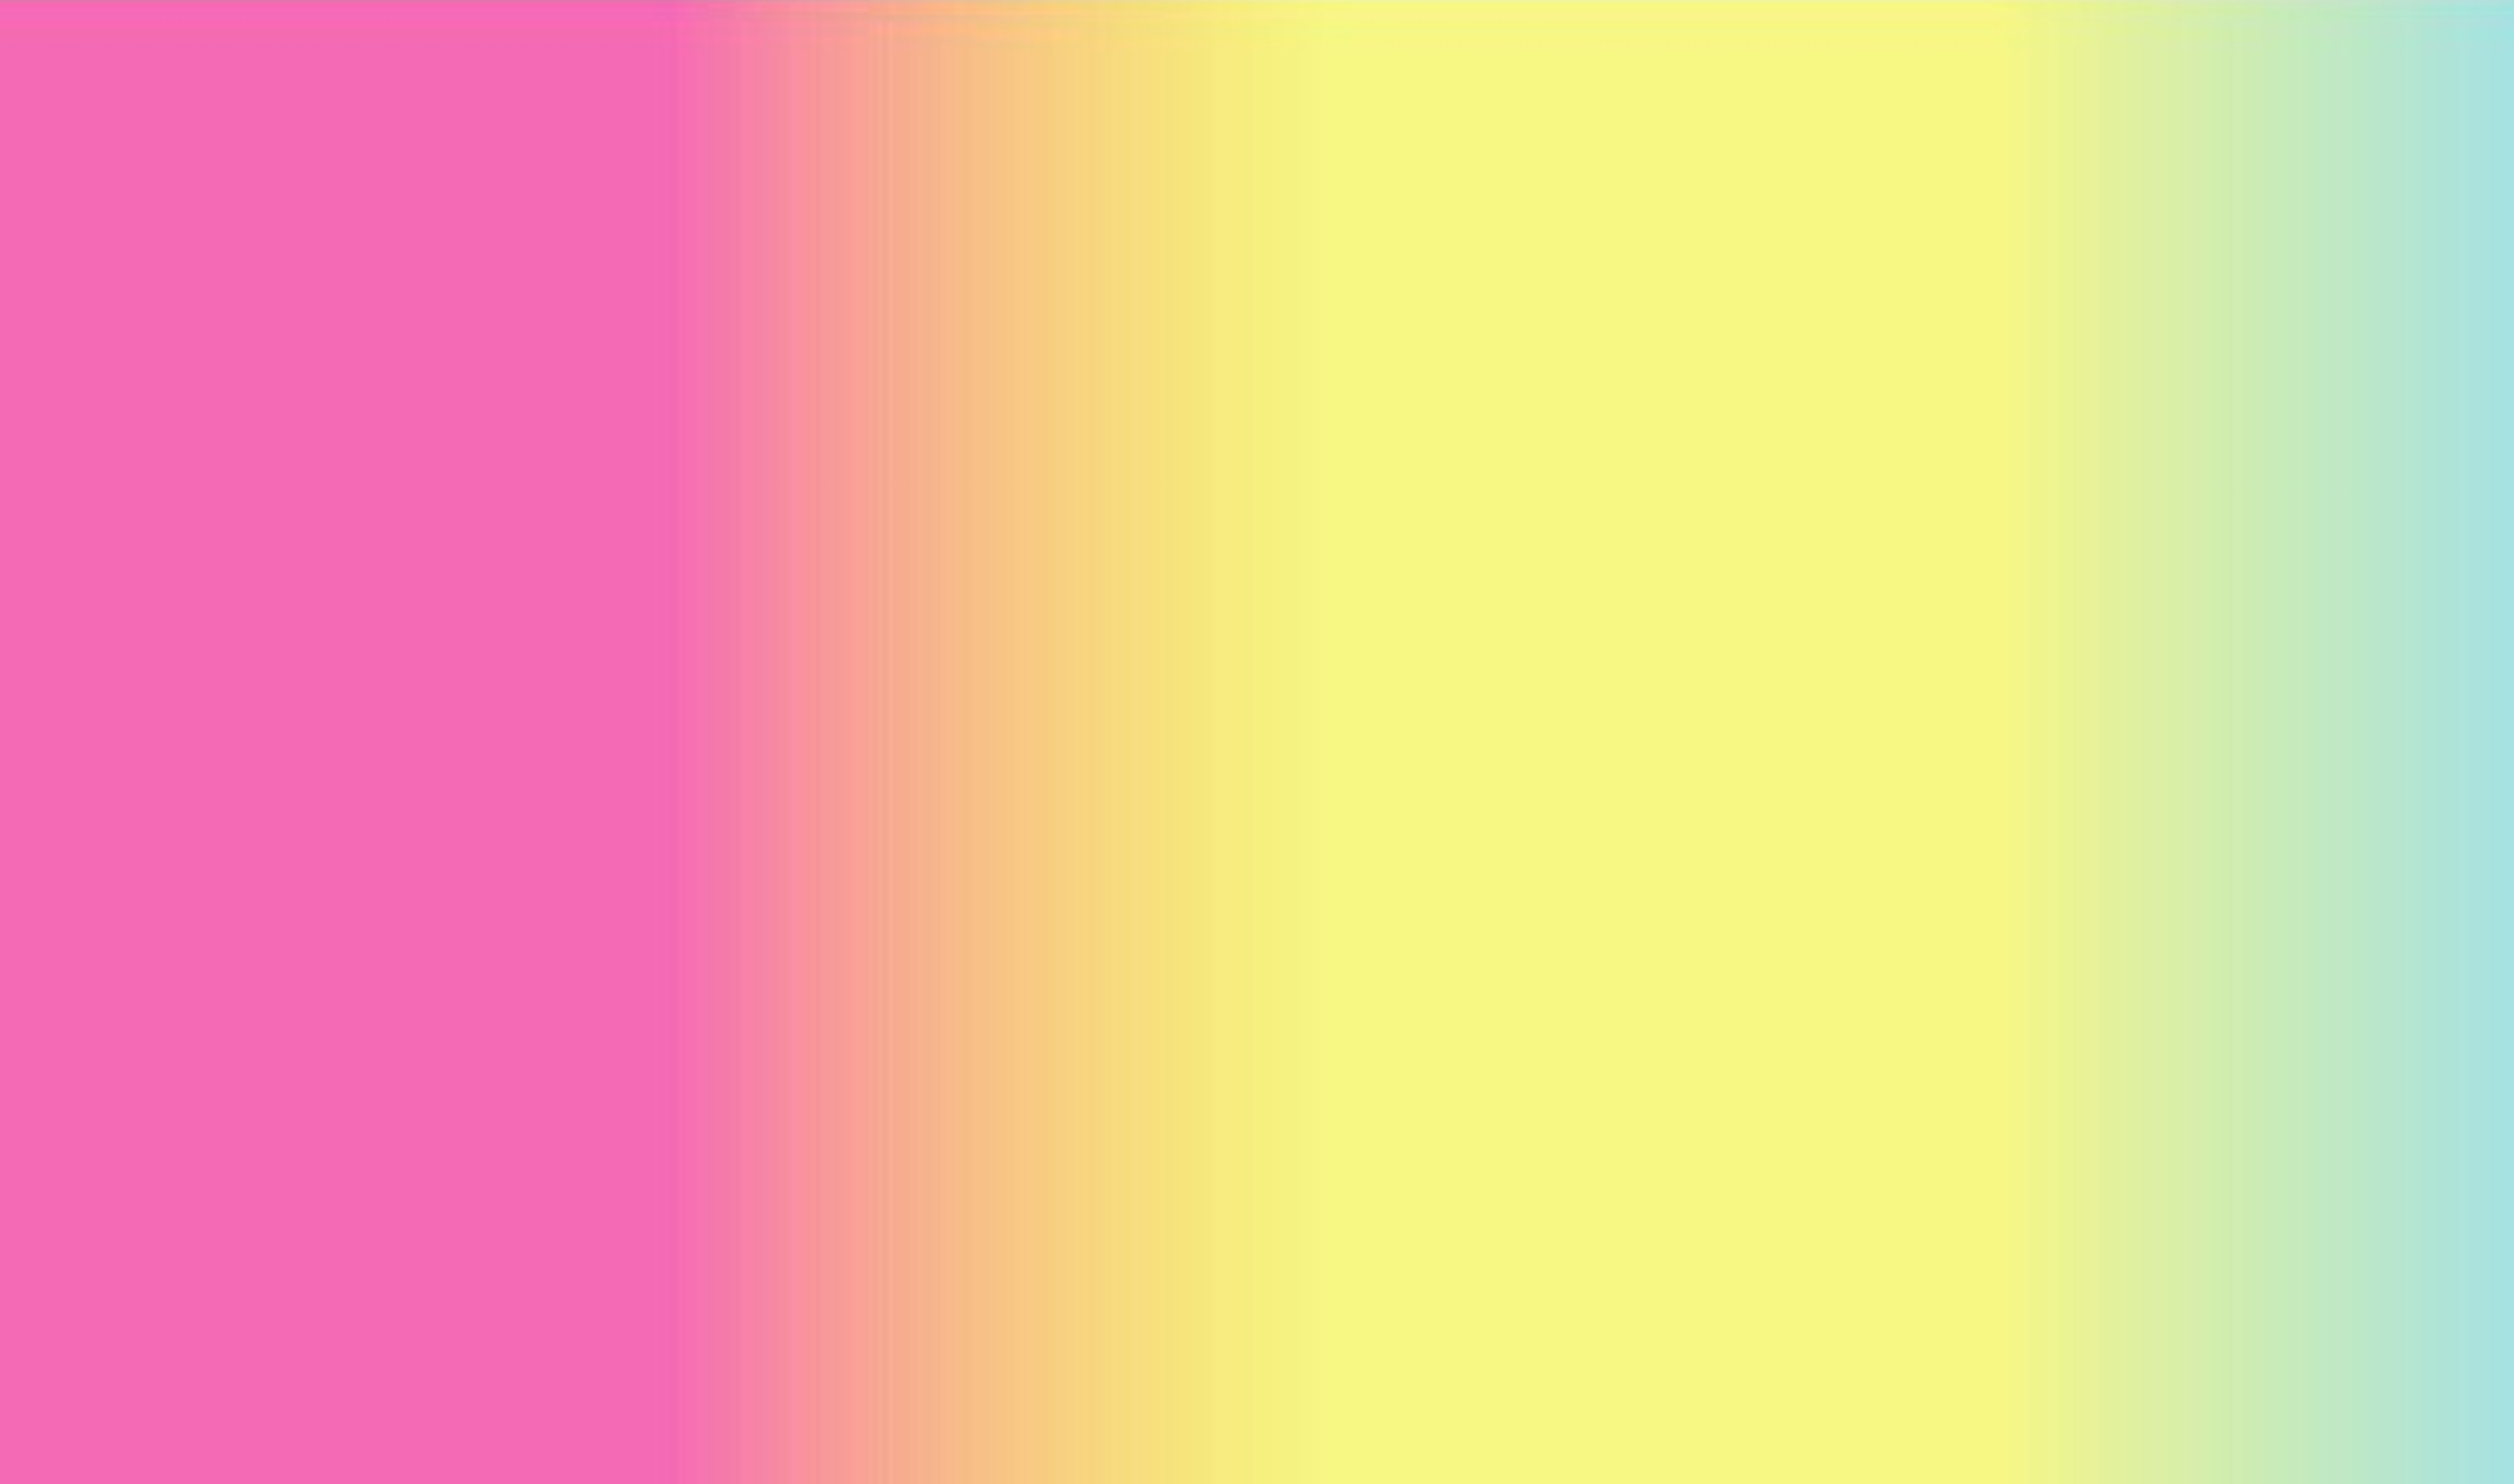
In Processing, we converted the values of the three key brainwave frequencies—Attention, Meditation, and Delta— into an interactive art display. The three key frequencies are represented by three colors respectively: Pink, Yellow, and Blue.
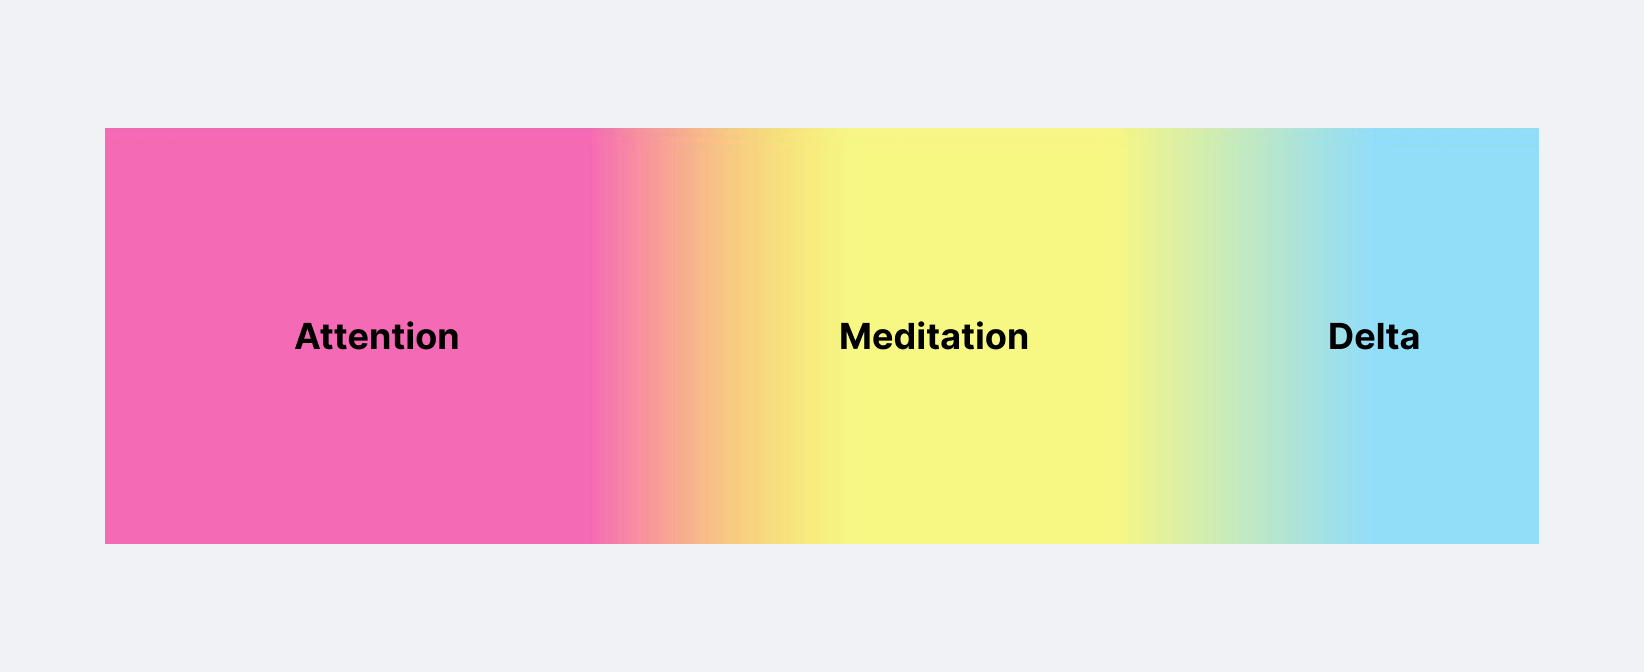
As the magnitude of brainwave activity changes at each frequency, the intensity and size of the corresponding color grow, creating a dynamic visual representation of the user’s dominant mental state. Additionally, the user can change the color scheme through button input, transforming the visualization into a captivating light show.
Final Product
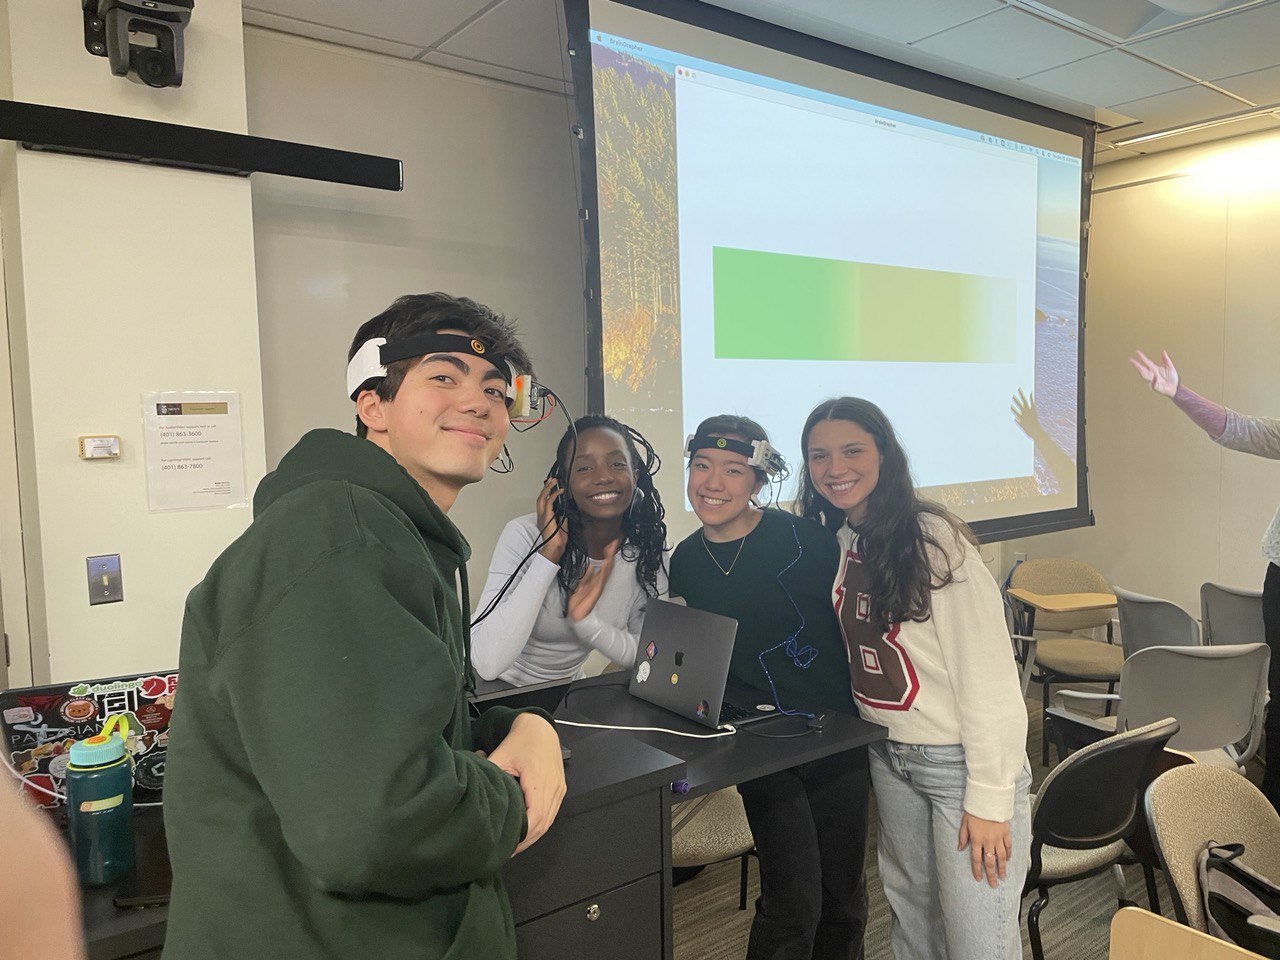
With everything in place, we demonstrated our project to our clasmates! We invited everyone to come up and try the headset, and watch as the colors on the visualization changed as they entered different mental states. We encouraged them to experience these different states by playing music that encouraged flow, and telling stories that evoked a certain emotional/mental response..
Here, a classmate tries on the headset, showing how the color intensities and sizes adjust in real time. The visualization indicates that 'Meditation' (Yellow) is the dominant mental state, highlighted by the increased intensity and width of the color.
Reflections
This project was a great opportunity for me to enjoy the creative process, as we worked together as a group to bring our ideas to reality.
Goals Met
We were able to fulfill our goals of...
- Reading the intensity of brainwave activity by hacking a MindFlex headset in order to detect a change in mental state
- Visualizing brainwave data as an interactive visual display, with the intensity and size of the color section changing based on the changes in brain wave intensity
- Integrating button input as an interrupt that adjusts the color of the display
- Integrating a WDT that resets the system upon detection of a system hang for more than 9 cycles
- Integrating WiFi into our project
Challenges
We encountered challenges in visualizing brainwave data, ultimately opting for Processing to convert Arduino-processed CSV data into a simple colored rectangle with smooth color blending and size adjustments, due to limited visualization options. We also struggled with serial communication and later pivoted to a WiFi implementation. Although we initially planned to use the Serial Monitor, we misunderstood the project requirements. Attempting to connect our web-app to the Arduino proved difficult, so we adapted by using random numbers from random.org to modify the visualization instead, building on existing lab code.
Final Thoughts
Nevertheless, I am very proud of what we created and I think we've learnt a lot through this project. Most of us had never done robotics or hardware engineering before, but we picked up skills along the way and made it happen!
Go team!ヾ(≧▽≦*)o