Harry Potter and the Prisoners of Data Science
Analysing Harry Potter movie scripts using hypothesis testing and machine learning
Role
Data Scientist
Date:
Feb to May 2024
Team
Toshiki Kato,
Raphael Li
Skills
Web-Scraping, SQL,
Machine Learning,
Data Viz
Overview
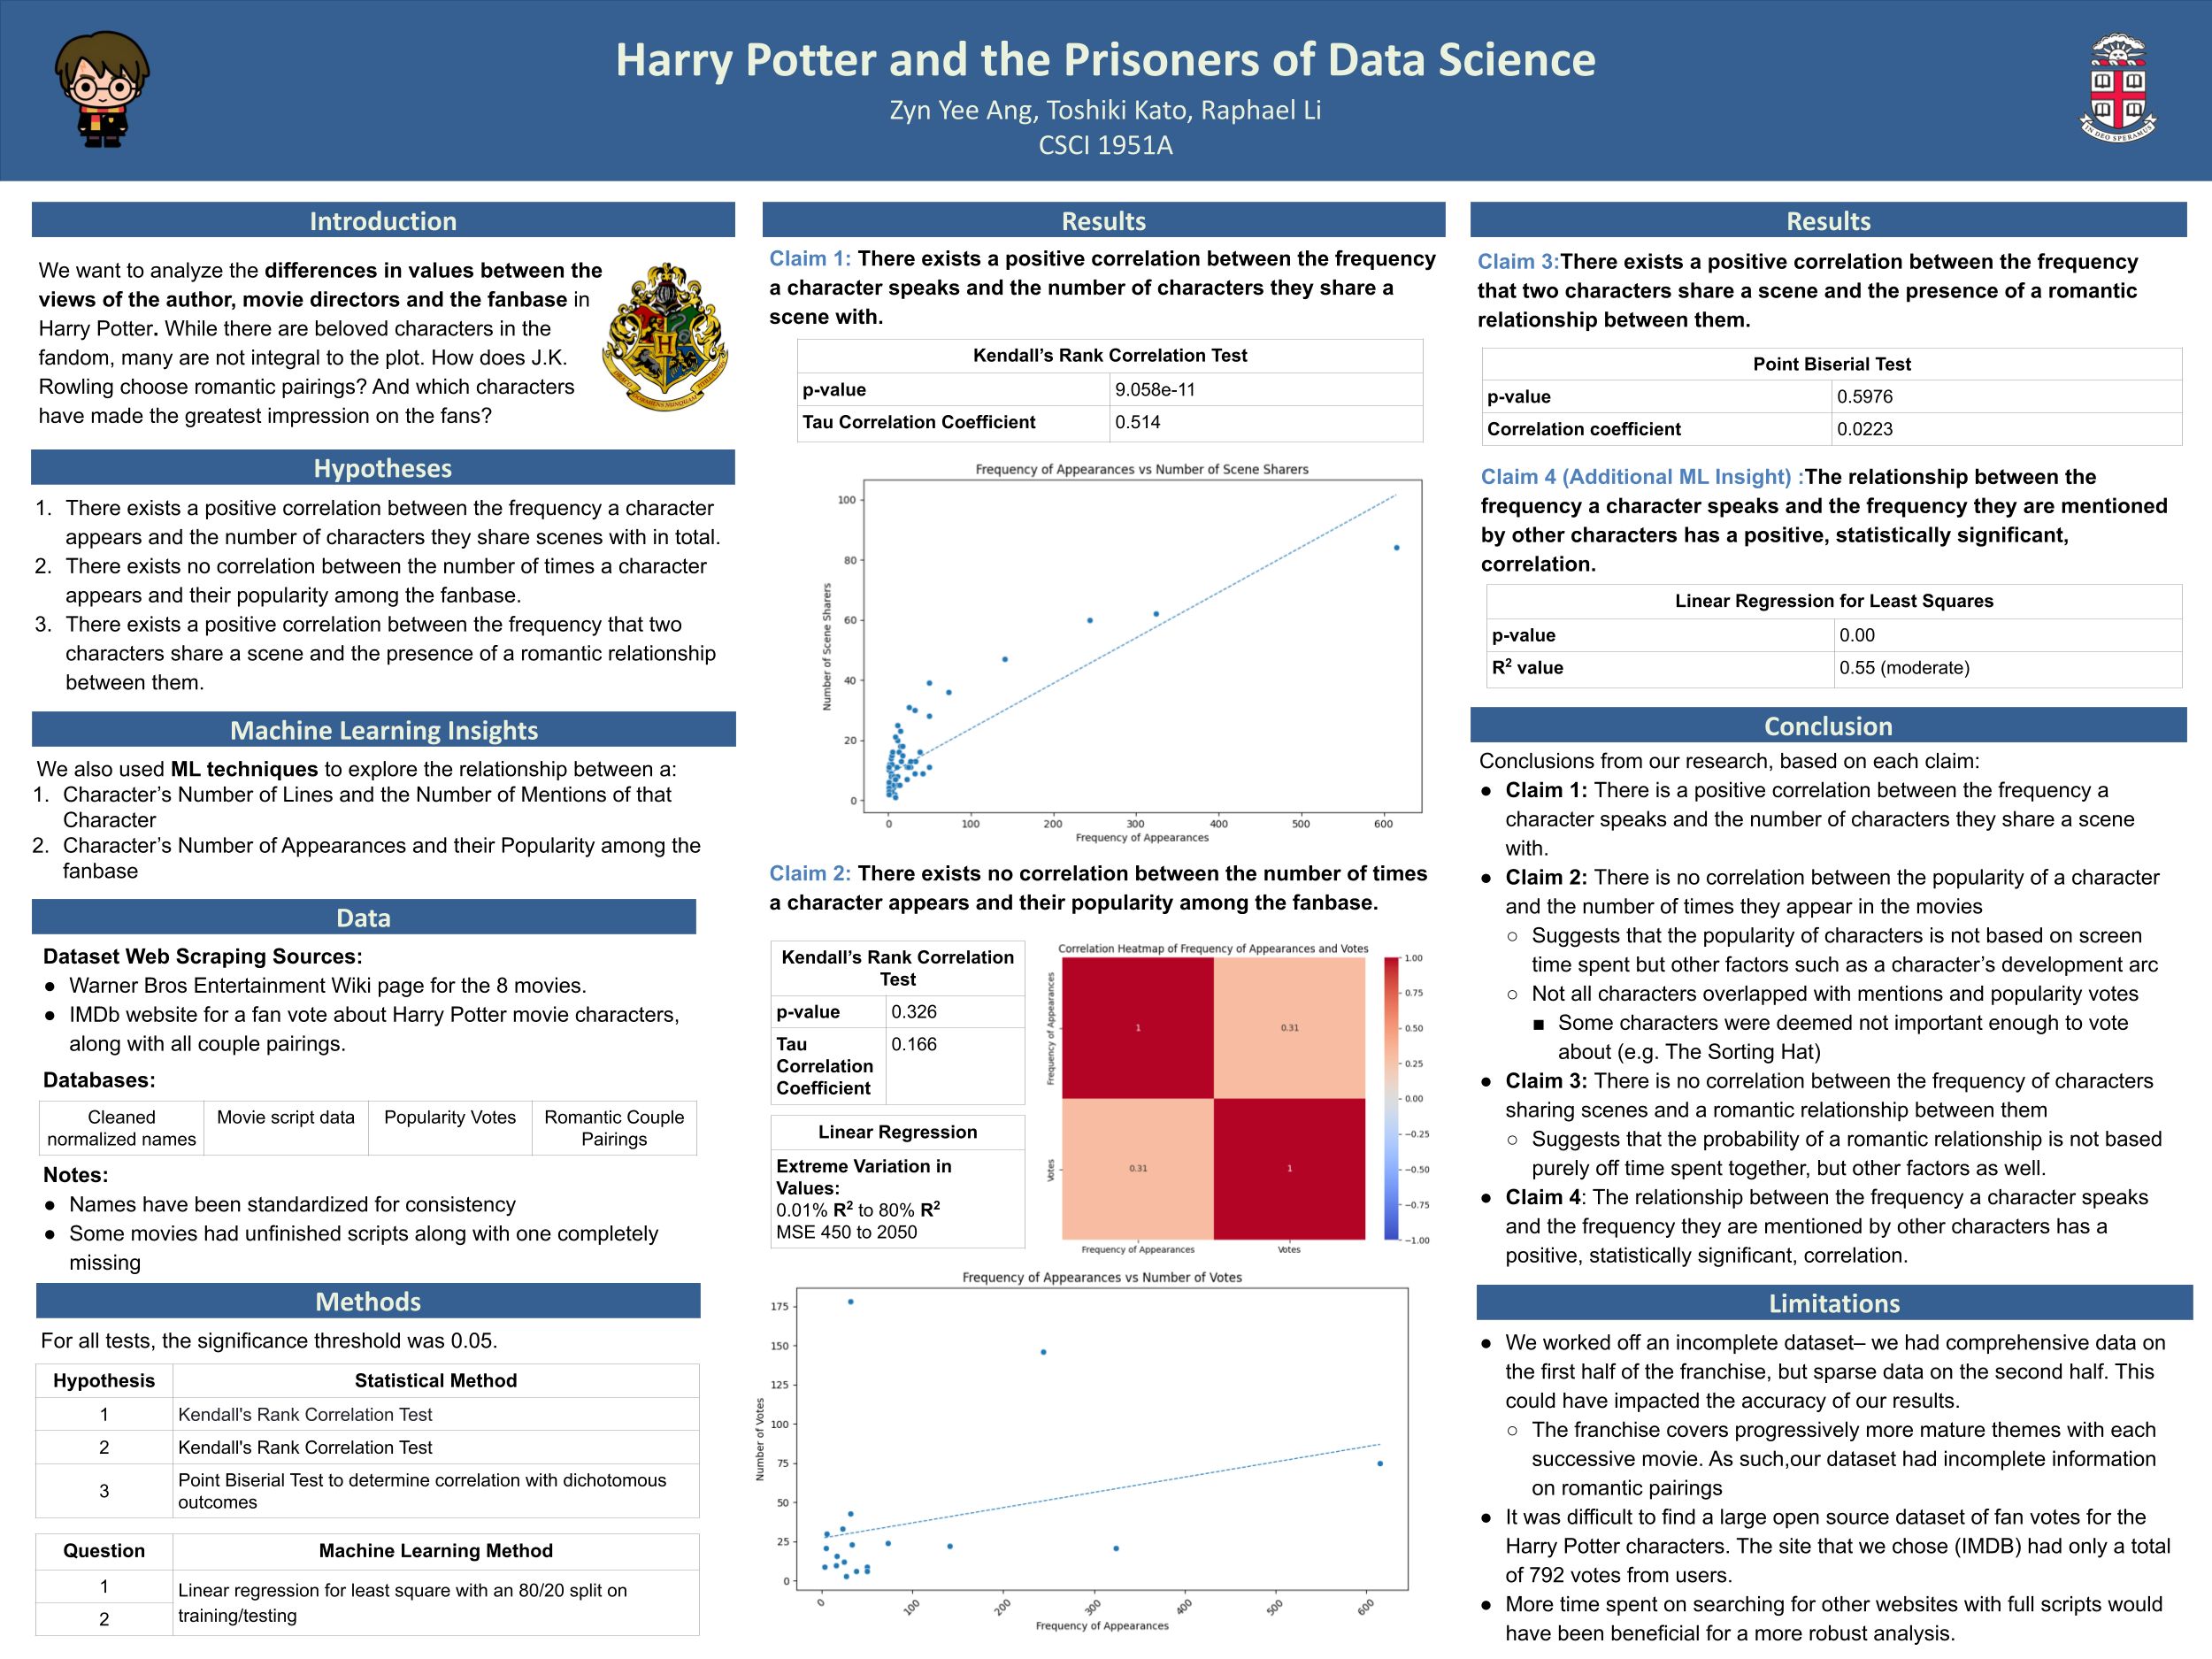
As Potterheads🪄, our team wanted to explore the various relationships in the Harry Potter universe using quantitative methods. We were specifically interested in analyzing the differences in values between the views of the author, movie directors and the fanbase in Harry Potter. How does J.K. Rowling choose romantic pairings? Which characters have made the greatest impression on the fans? And is there a correlation to be found between these factors?
Our Hypotheses
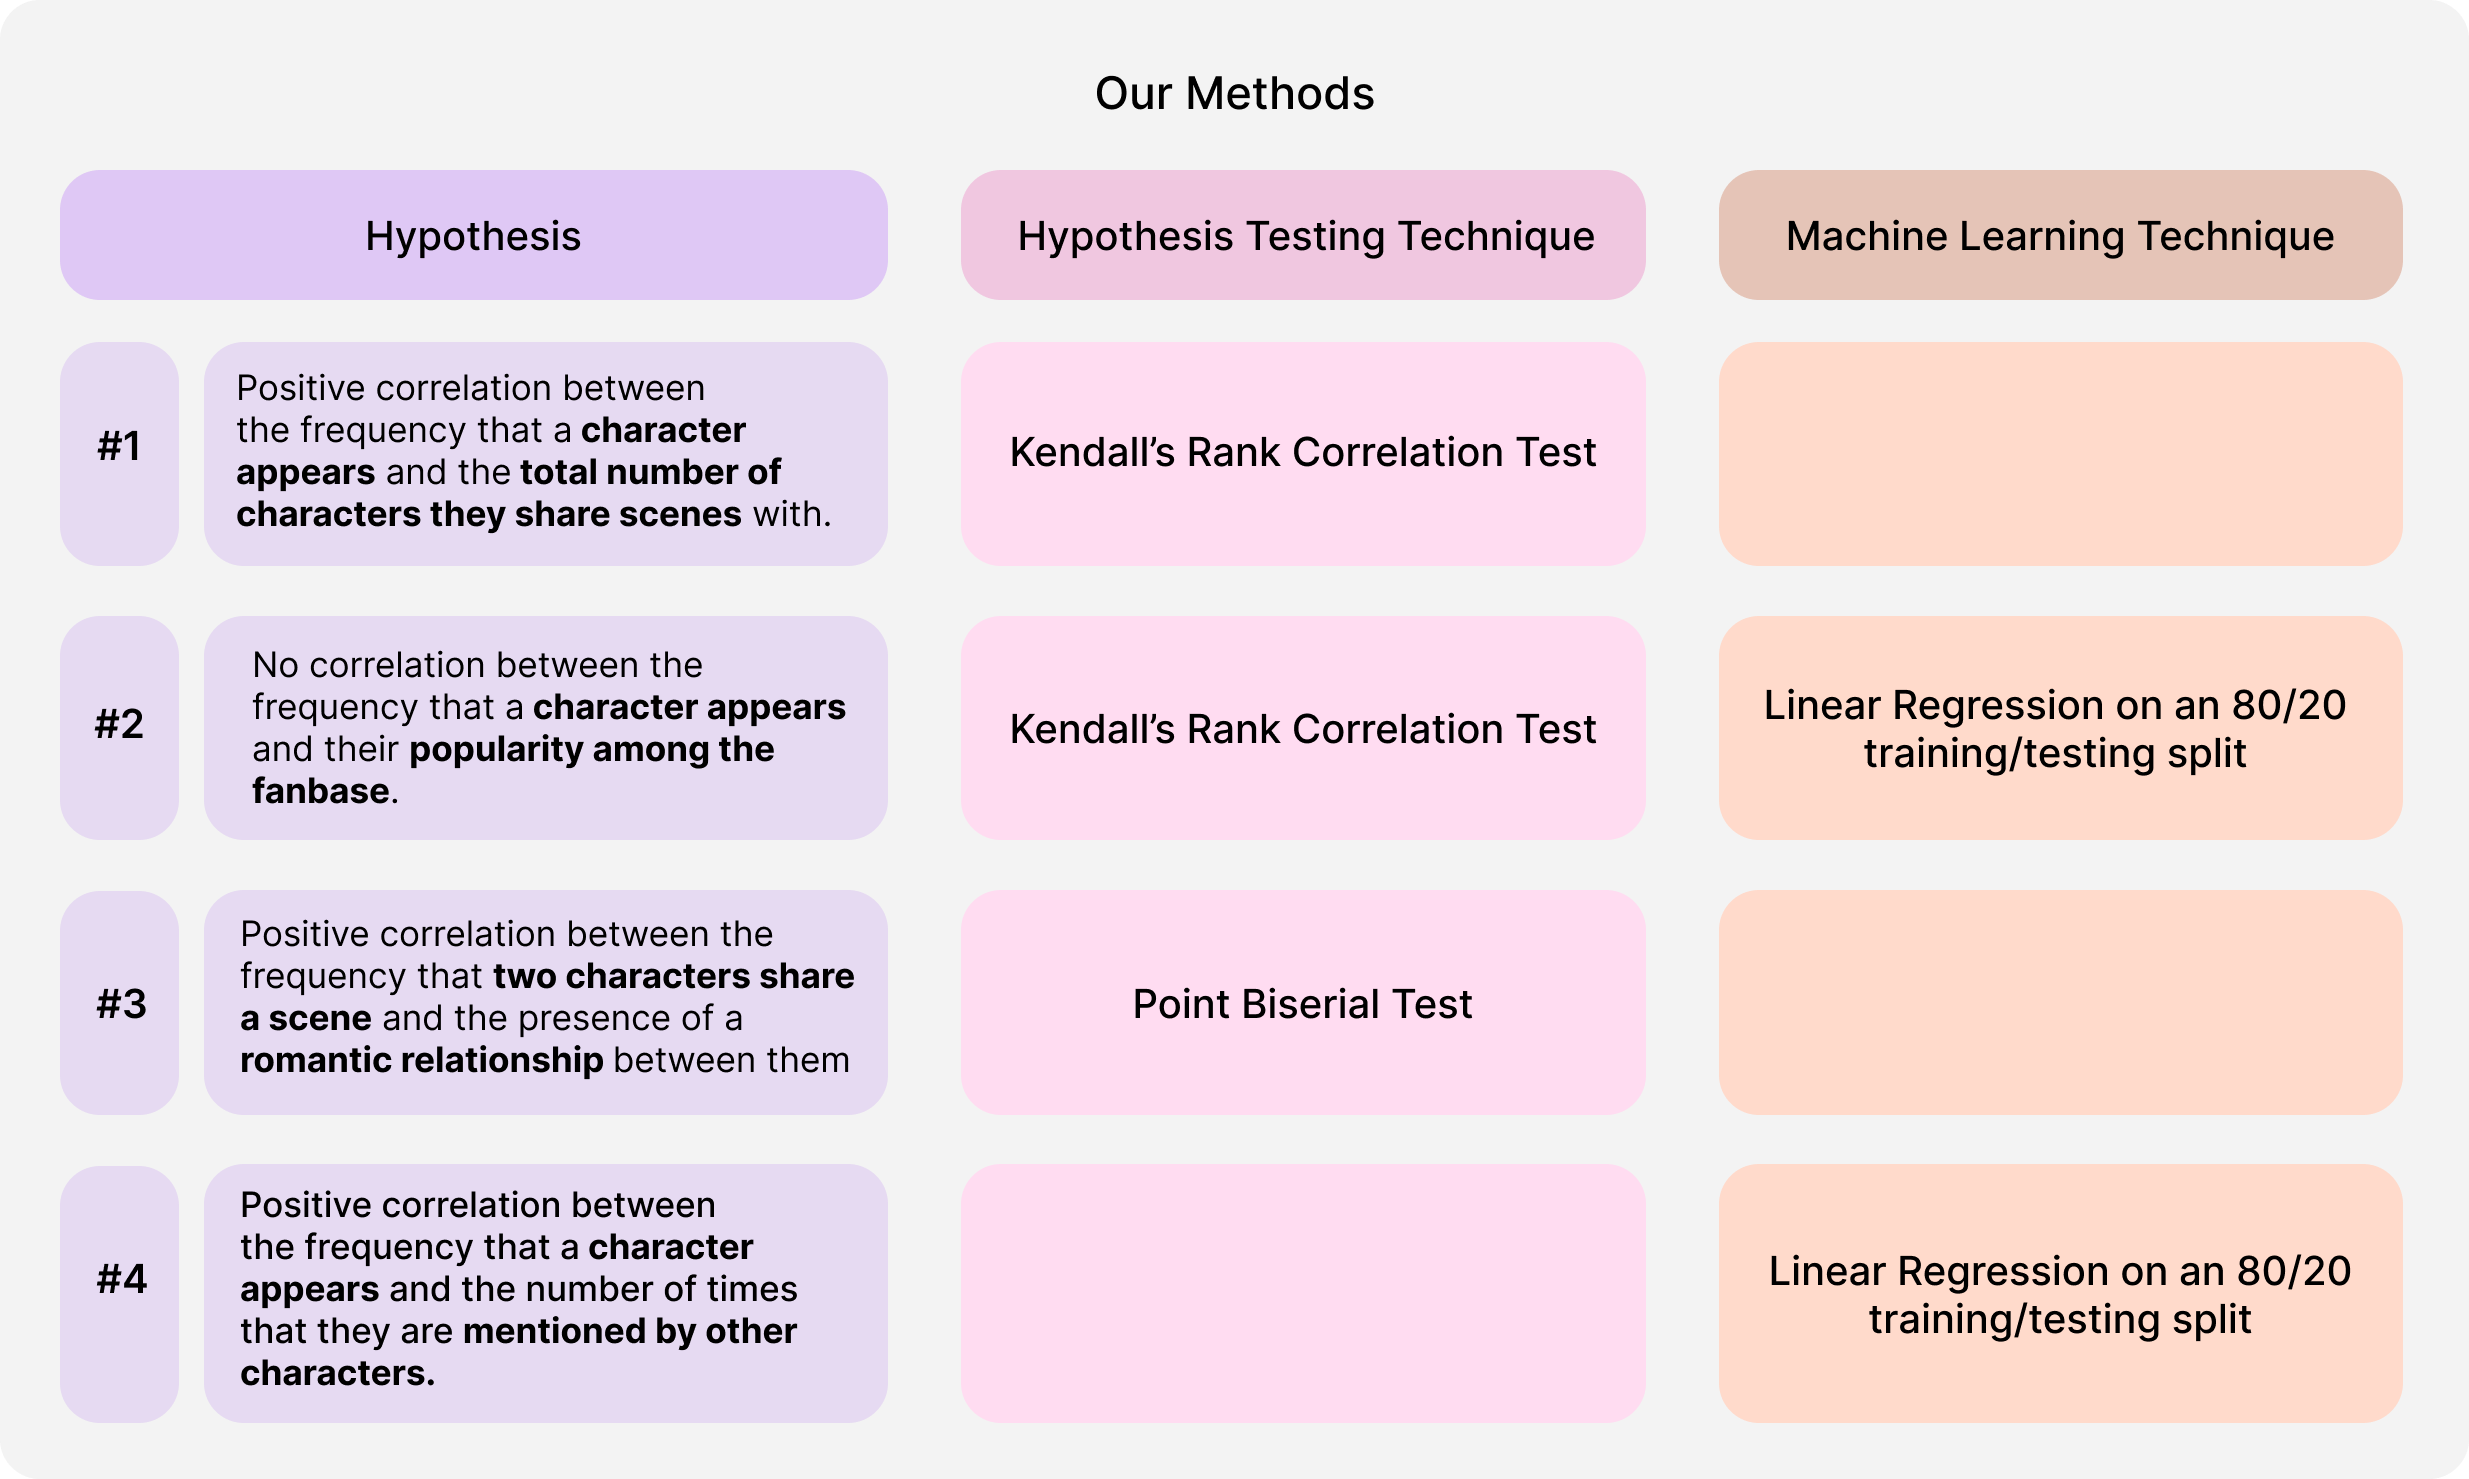
Based on our interests, we had 4 research hypotheses:
- 👯There exists a positive correlation between the frequency that a character appears and the total number of characters they share scenes with.
- 💖There exists no correlation between the frequency that a character appears and their popularity among the fanbase.
- 🌹There exists a positive correlation between the frequency that two characters share a scene and the presence of a romantic relationship between them.
- 🗣️There exists a positive correlation between the frequency that a character appears and the number of times that they are mentioned by other characters.
Data Collection
We decided to focus our attention on the movie scripts of the franchise, and webscrapped them from a fan-hosted Warner Bros Entertainment Wiki. We also webscraped the results of a fan vote from an IMDB poll, for our analysis of the correlation between character appearances and popularity among the fanbase.
We used Python's BeautifulSoup package to parse the HTML of the wiki site and scrape all information related to the script, including scene data, speakers and dialogue. We used the same strategy to collect data on fan votes from the IMDB poll.
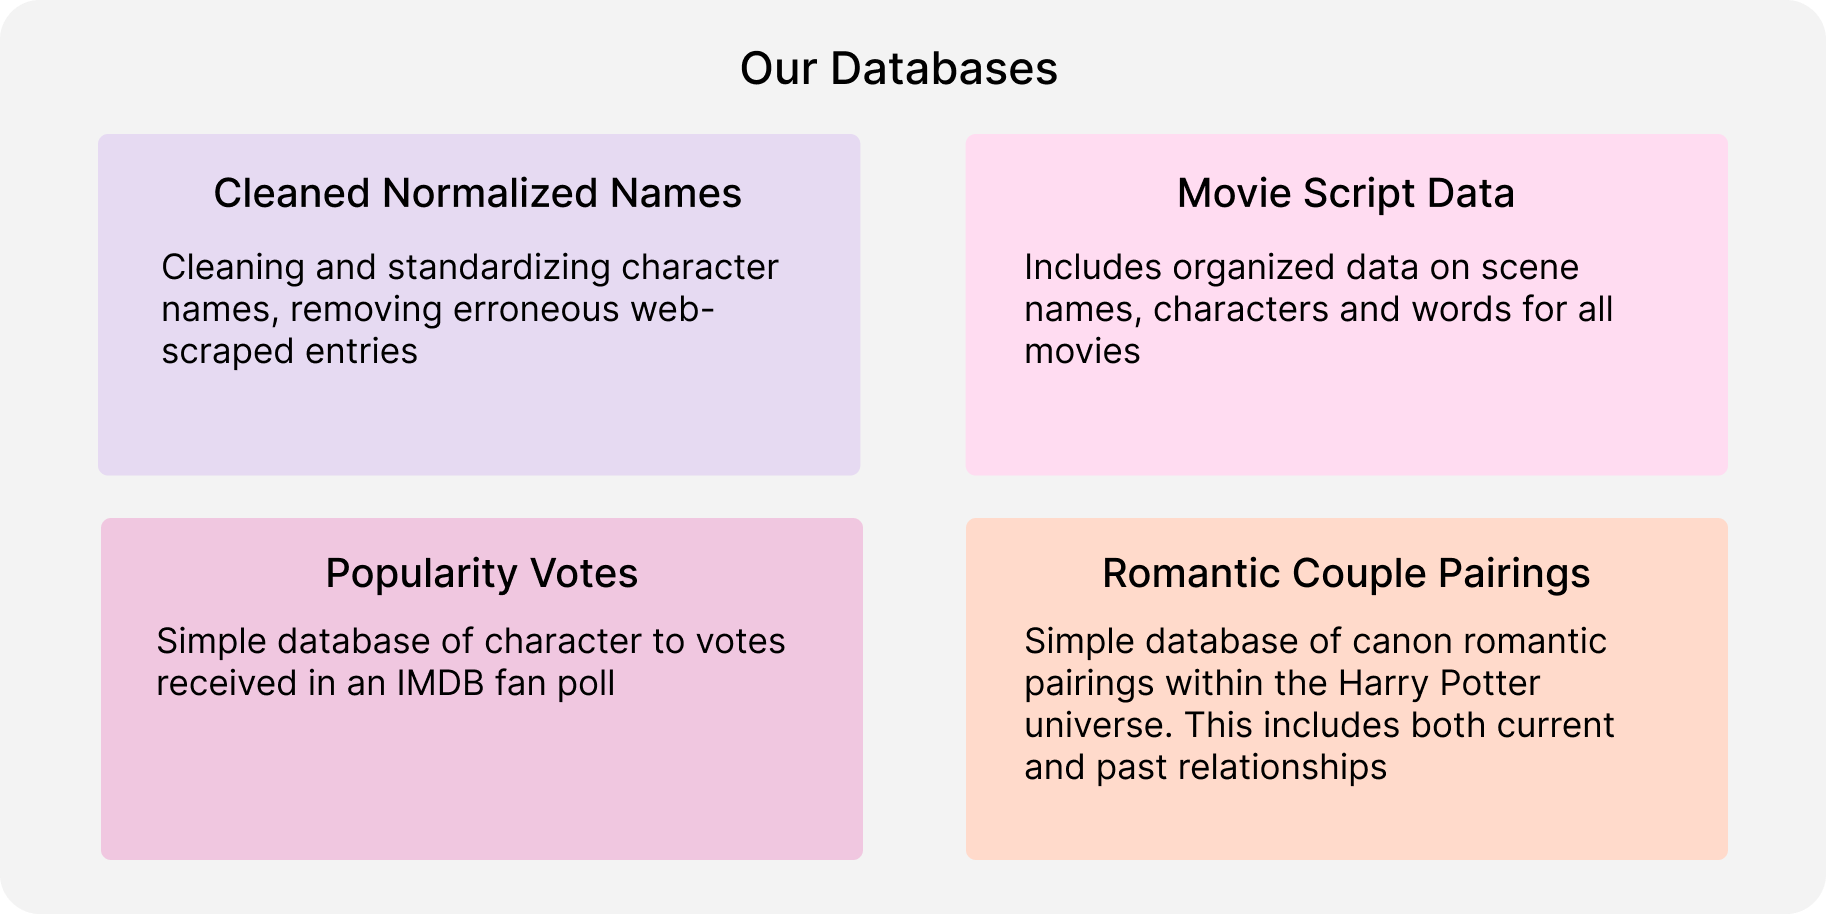
We cleaned the raw data, then converted and sorted them into SQL databases for easy querying and manipulation.
Methods
We used a mix of hypothesis testing and machine learning methods to investigate each of our hypotheses.
We used Python's SciPy and Scikit-Learn libraries to conduct these tests. Below is a more in-depth discussion of our rationale for each of these tests. Feel free to skip to Results!
Hypothesis #1
To test this hypothesis, we used Kendall's Rank Corrrelation Test. We used this statistical test because
- Continuous / Ordinal Variables: The variables are continuous and Kendall's is suitable for measuring the relationship between 2 continuous variables
- Variables are NOT normally distributed: The distribution of the variables instead resemble negative exponential distributions with a few outliers
We also considered Chi-Squared Independence Tests and Pearson's Correlation, but those tests were not suitable for the distribution and nature of our variables.
Hypothesis #2
To test this hypothesis, we used Kendall's Rank Corrrelation Test and Linear Regression. We chose Kendall's Rank test because of the same rationale as above. As for linear regression, we used it because it is suitable for correlation testing.
We also attempted Kmeans clustering on the dataset using these two variables as the axis but ran into an issue where it created clusters that were much closer in similarity than we expected and appeared partially random.
Hypothesis #3
To test this hypothesis, we used a Point Biserial Test. We used this statistical test because
- Continuous Variable and Dichotomous Variable: The variables in our test are continous (the number of times two characters share a scene) and dichotomous (the presence of a romantic relationship between them). The point-biserial test is specially designed to derive the correlation of 2 such variables
- Variables are NOT normally distributed: Although the point-biserial is considered a special case of Pearsons correlation, it does not necessarily assume that the continuous variable follows a normal distribution. Nevertheless, we acknowledge that it is classically used to measure data with normal distributions
We also considered Mutual Information, but were unable to obtain meaningful results from the test.
Hypothesis #4
To test this hypothesis, we used Linear Regression. We chose linear regression, because it is suitable for correlation testing.
We also considered clustering to see if there were certain distinct groupings of characters (ex. minor vs main characters), but we thought that linear regression would have the most insights.
Results
Through conducting hypothesis testing and machine learning, we were able to test the validity of our hypotheses. The following are our results for each hypothesis, with accompanying visualizations created with MatPlotLib and Seaborn:
Hypothesis #1
✅There exists a positive correlation between the frequency a character speaks and the number of characters they share a scene with.
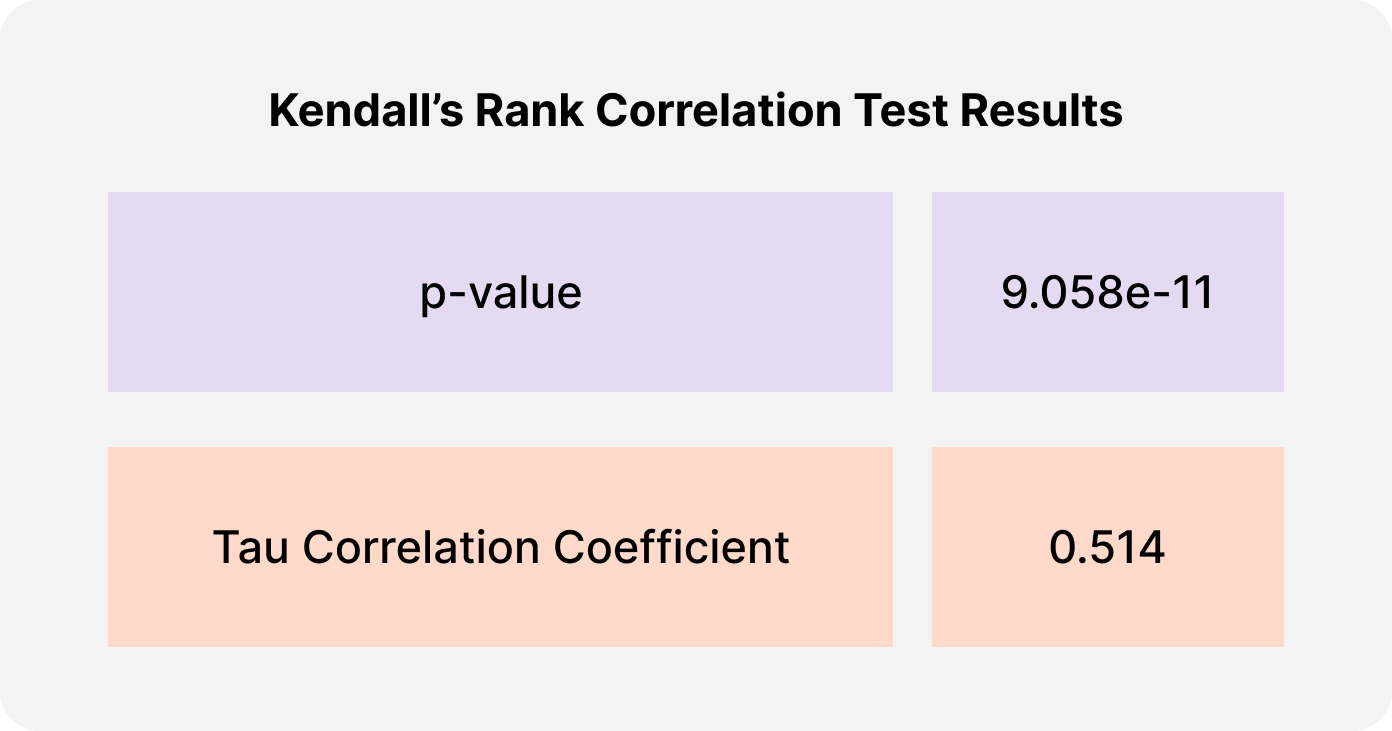
Based off a significance threshold of 0.05, the results of Kendall's Rank Correlation test reveal that the observed correlation is statistically significant and not likely due to random chance-- allowing us to reject the null hypothesis. The tau correlation coefficient value is also a moderately high, which suggests a moderate positive correlation between the two variables
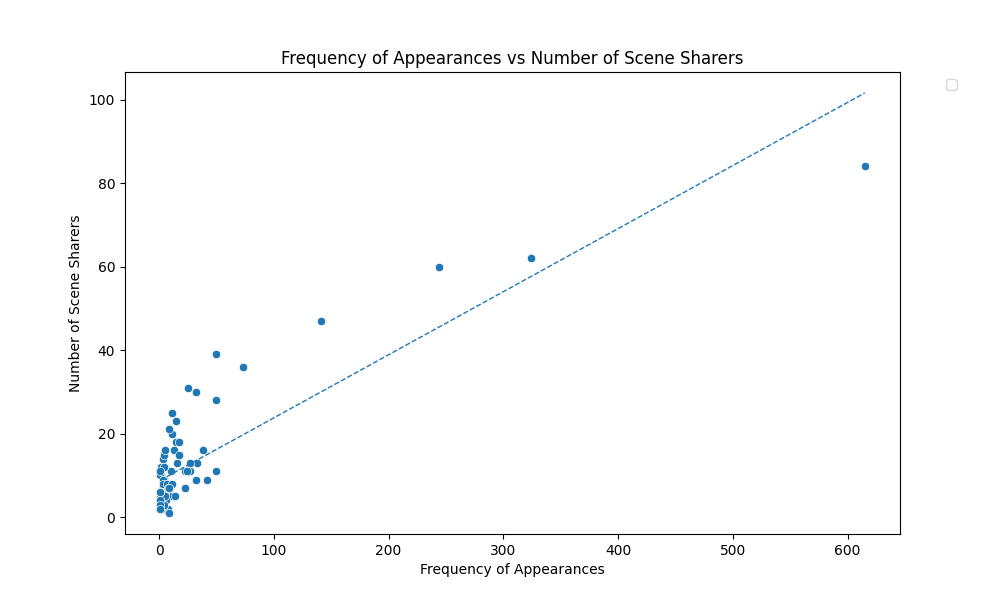
The graph above provides a useful visualization of the positive relationship between the two variables, with the best-fit line indicating the general trend.
Hypothesis #2
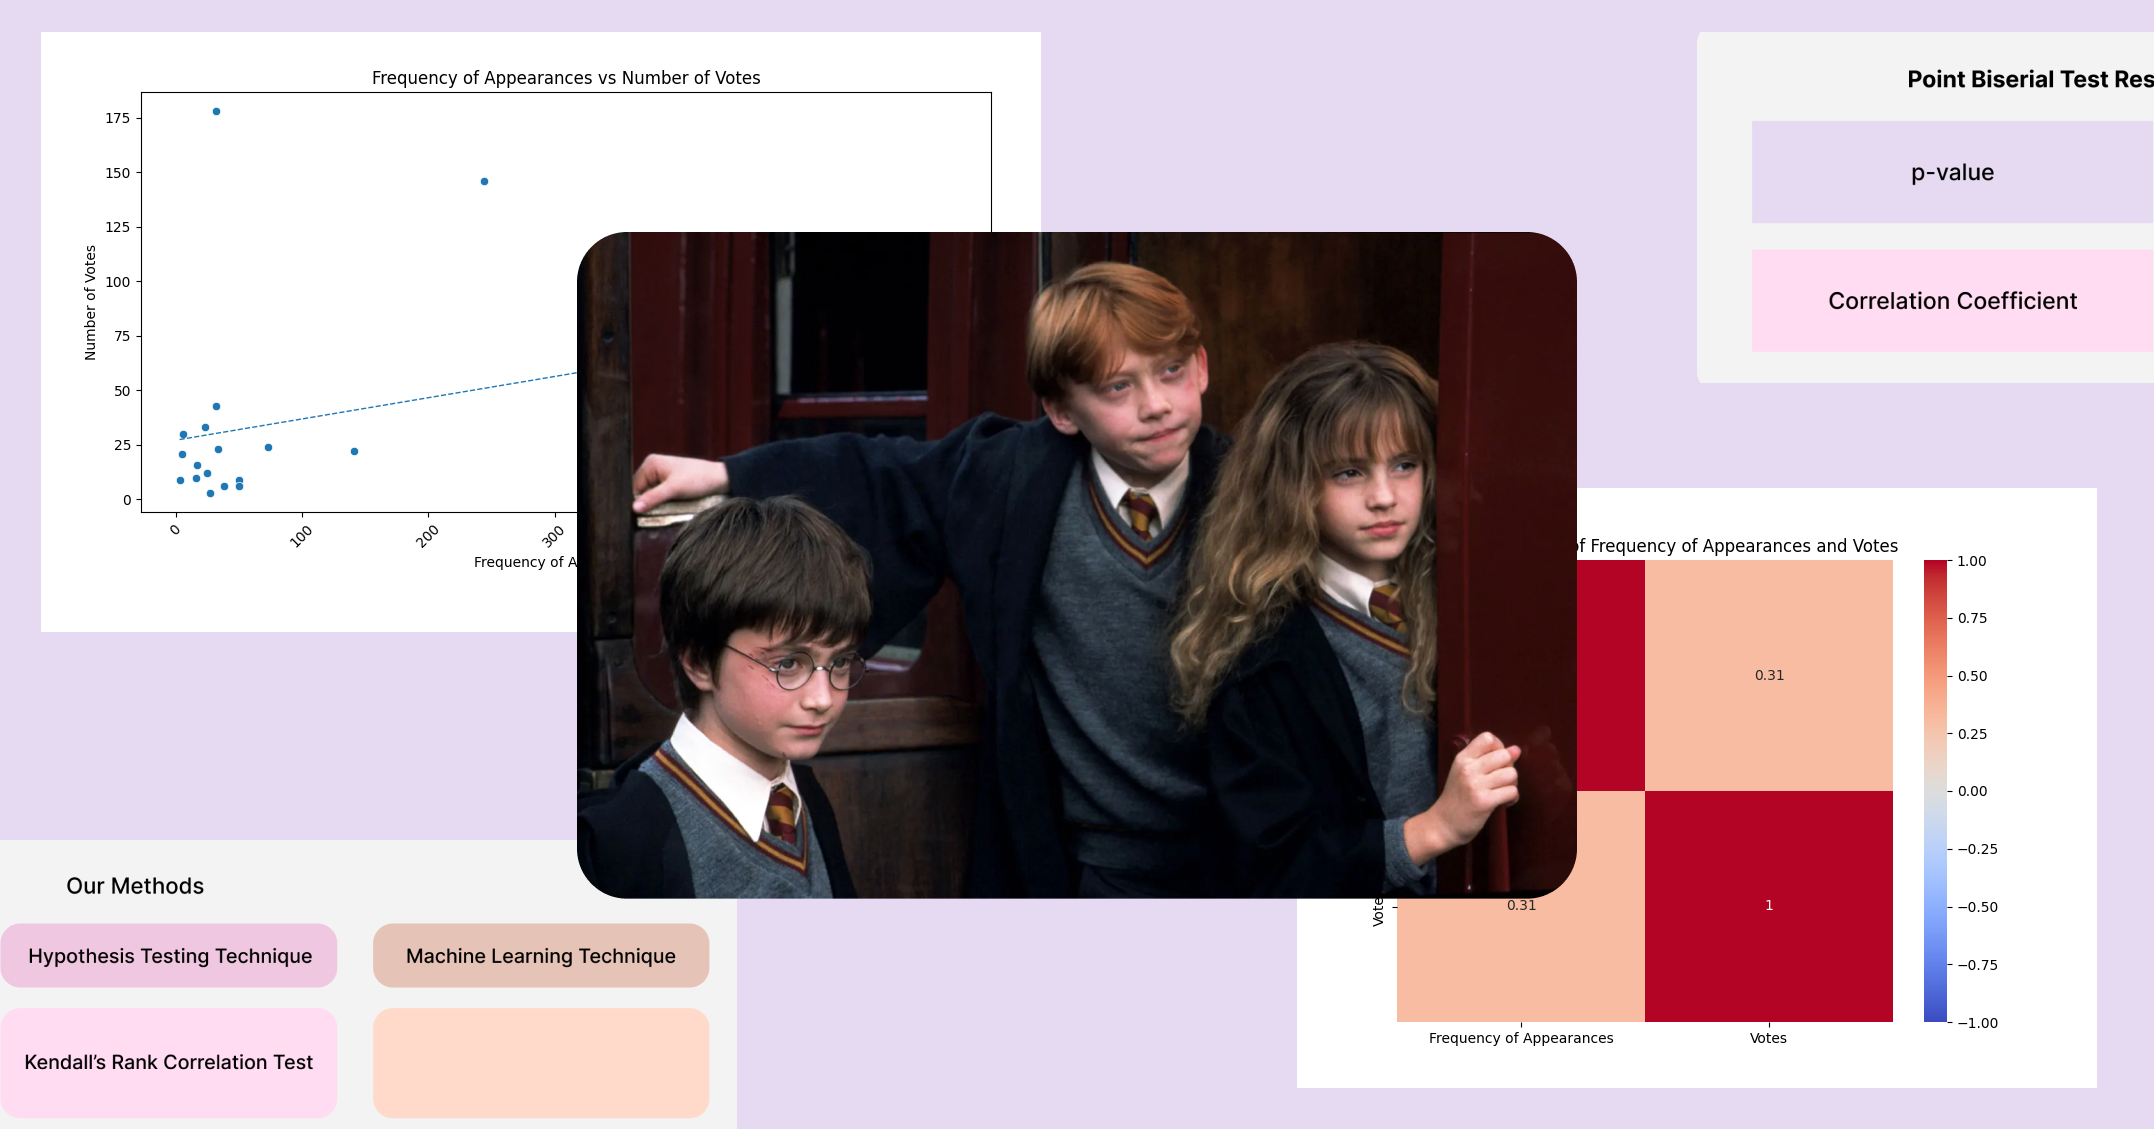
❌There exists no correlation between the number of times a character appears and their popularity among the fanbase.
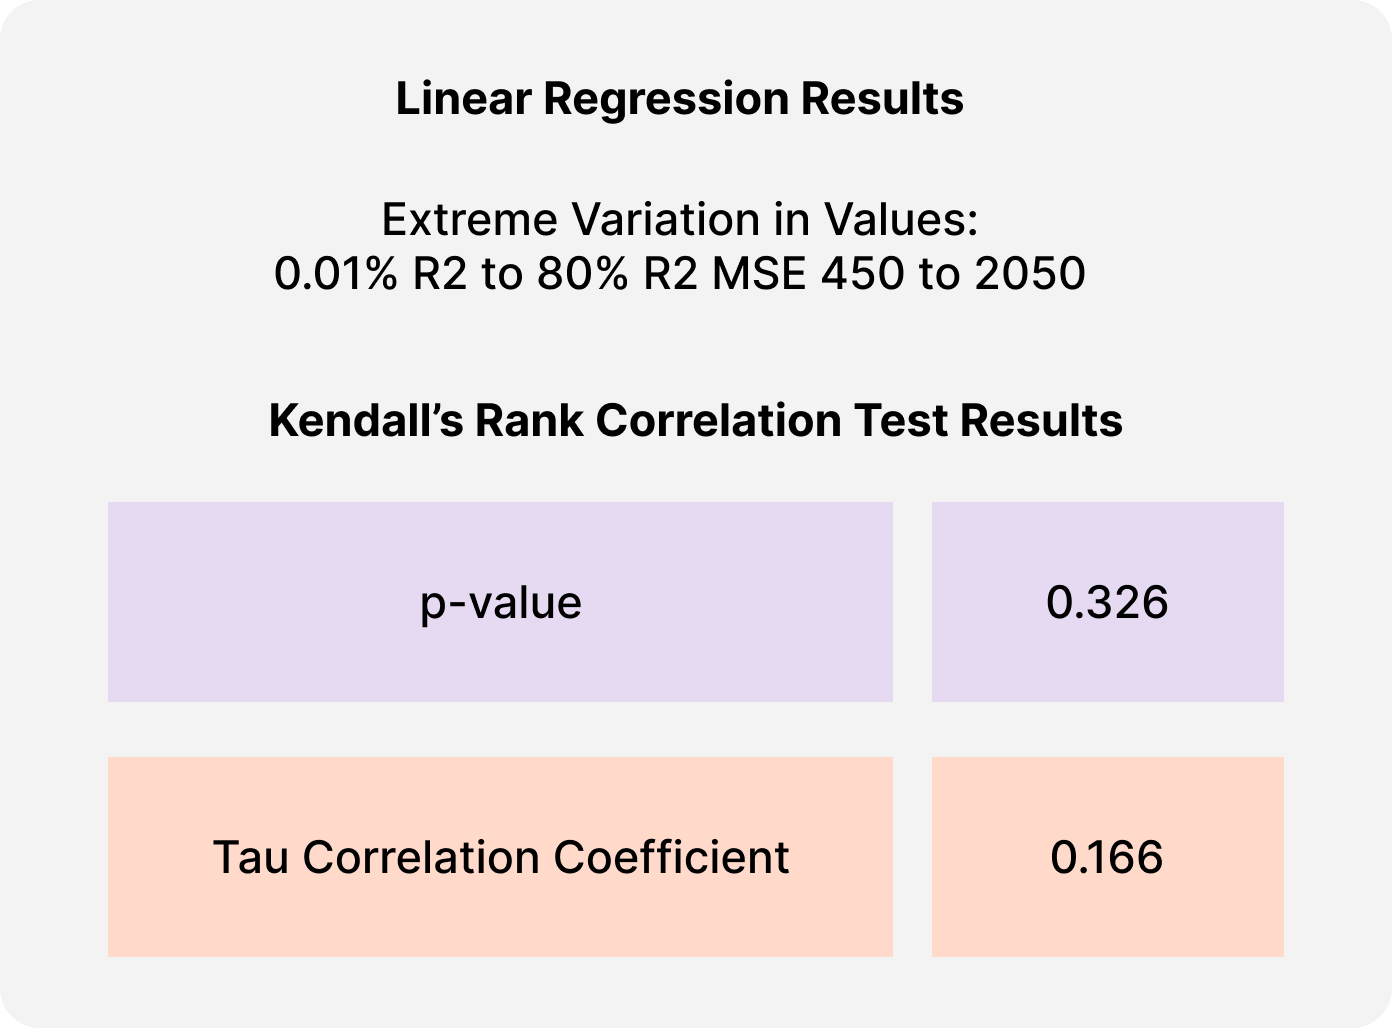
Based off a significance threshold of 0.05, the results of Kendall's Rank Correlation test reveal that the observed correlation is NOT statistically significant and likely due to random chance-- which means that we are unable to reject the null hypothesis. The tau correlation coefficient value is also low, which suggests a weak positive correlation between the two variables.
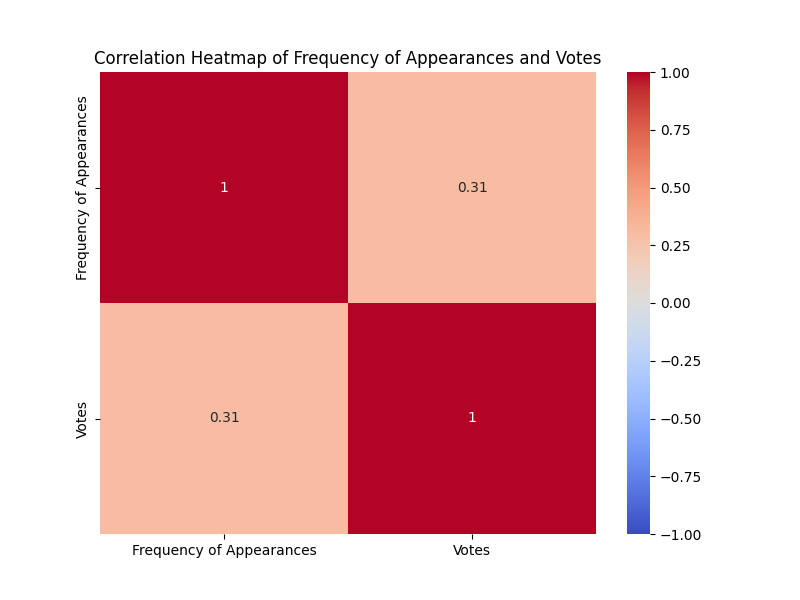
The heatmap below visualizes the weak positive correlation between the two variables. A stronger correlation would have been represented by a darker shade of red
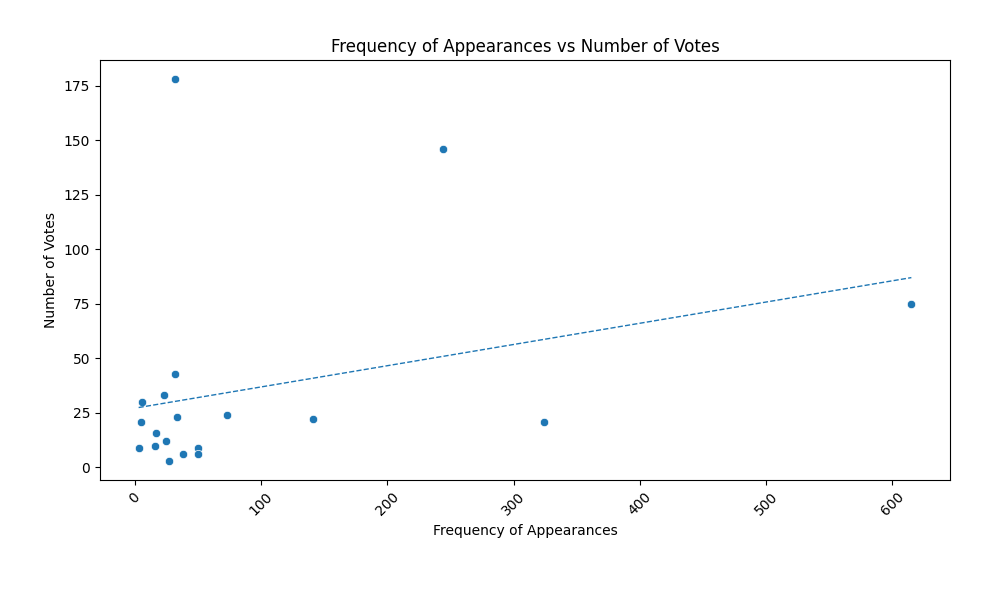
The scatterplot below reveals a random distribution of the datapoints, a feature of our dataset which makes it difficult to prove correlation between the two variables.
Hypothesis #3
❌There exists no correlation between the frequency that two characters share a scene and the presence of a romantic relationship between them.
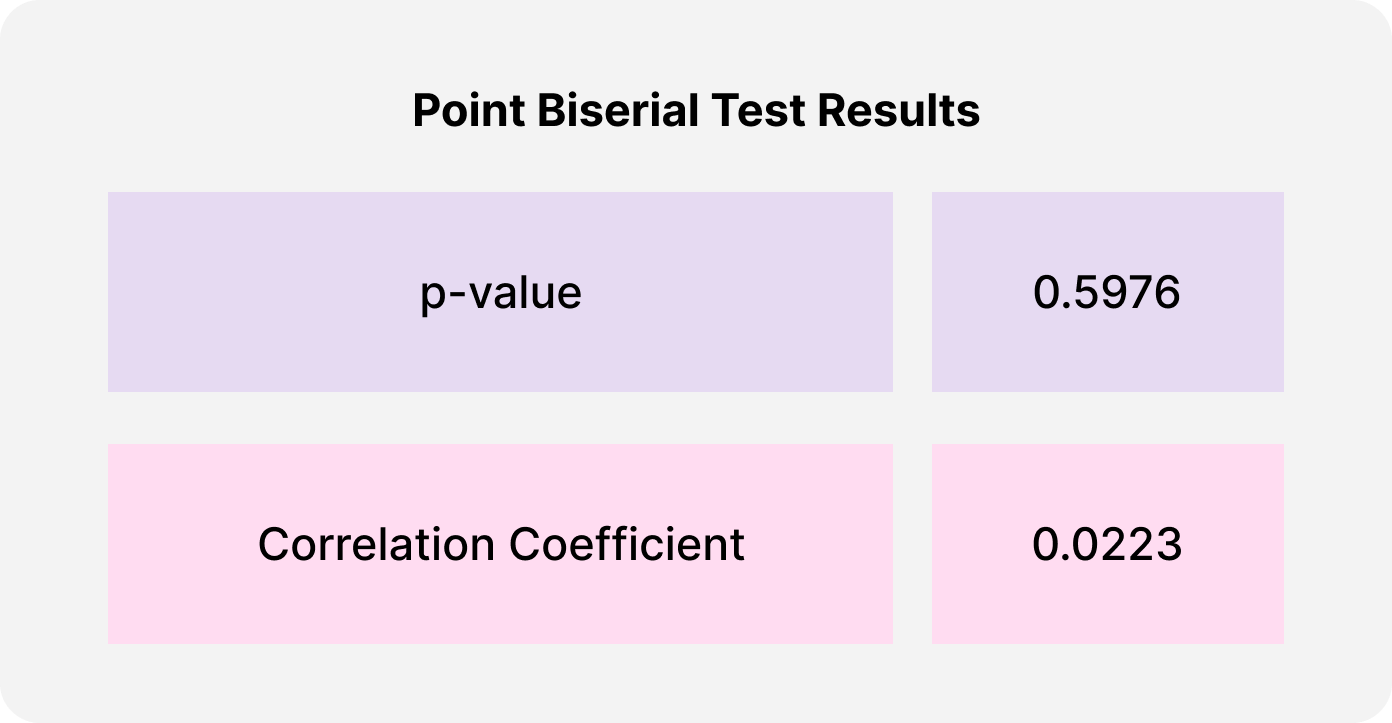
Based off a significance threshold of 0.05, the results of the Point Biserial test reveal that the observed correlation is NOT statistically significant and likely due to random chance-- which means that we are unable to reject the null hypothesis. The correlation coefficient value is also low, which suggests a weak positive correlation between the two variables.
Hypothesis #4
✅There exists a positive, statistically significant relationship between the frequency a character speaks and the frequency at which they are mentioned by other characters.
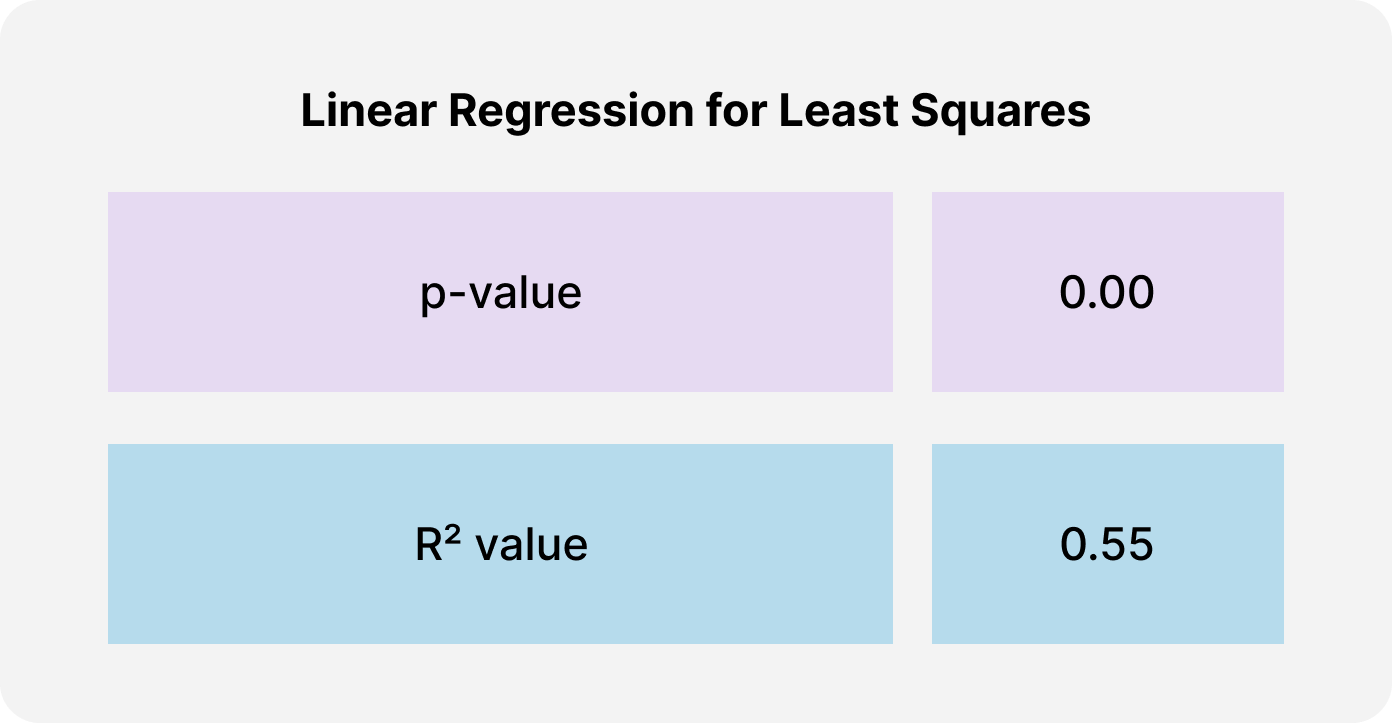
Based off a significance threshold of 0.05, the results of Linear Regression reveal that the observed correlation is statistically significant and not likely due to random chance-- allowing us to reject the null hypothesis. The moderate R^2 value of 0.55 means that 55% of the variation in the frequency that a character is mentioned by other characters, can be explained by the frequency a character speaks.
Limitations
Despite our best efforts, there were certain limitations we faced when trying to execute this project:
- We worked off an incomplete dataset-- we had comprehensive data on the first half of the franchise, but sparse data on the second half. This impacted the accuracy of our results.
- The franchise covers progressively more mature themes with each successive movie. As such, our dataset had incomplete information on romantic pairings
- It was difficult to find a large open source dataset of fan votes for the Harry Potter characters. The site that we chose (IMDB) had only a total of 792 votes from users.
- Not all characters overlapped with mentions and popularity votes within the IMDB poll-- some characters were deemed not important enough to vote about (e.g. The Sorting Hat).
Summary
As a quick summary of our work, here is a poster which captures all the main points of this project.
Reflection
I really enjoyed working on this project, because it allowed me to use practical data science skills on a topic that was interesting and enjoyable for me. The Harry Potter universe was a significant part of my childhood, and there were questions about the franchise that I've wondered about for a while that I managed to answer in this project through the use of data analysis.
Future Direction
To further iterate and improve on this project, I would work to expand the database so as to fill in all the gaps of missing information. I am also keen to use machine learning to conduct predictive analysis on questions such as the likelihood of a romantic relationship forming between two characters, or predicting if they would make it till the end of the series (or be unalived by JK Rowling)
Thank you for sticking with me through the end of this project!

Mischief Managed🪄